
Introduction
Mobile network performance is critical in determining user satisfaction and business success in today’s fast-paced digital landscape. Telecom performance management, centered on precisely monitoring and analyzing key performance indicators (KPIs), is crucial in delivering a seamless user experience. By gaining valuable insights into network health, identifying potential issues, and optimizing operations, operators can drive business growth and enhance network quality.
KPIs serve as the lifeblood of network performance, directly impacting the end-user experience. From call quality and data speeds to service availability, these metrics provide a clear picture of network performance. A positive user experience is underpinned by consistent and reliable network connectivity, directly linked to well-managed KPIs.
The complexity of modern mobile networks, with the coexistence of 2G, 3G, 4G, and 5G technologies, introduces a diverse range of KPIs. Moreover, each operator may prioritize metrics based on their business objectives and customer demographics, necessitating a tailored approach to performance management.
To effectively measure and improve network performance, it’s essential to categorize KPIs into meaningful groups. This blog delves into four key areas: Network Performance, Customer Experience, Network Efficiency, and Financial KPIs. By understanding these metrics and their impact on the end-user, telecom operators can make data-driven decisions to enhance network quality and drive business growth.
Mobile Network Performance Monitoring KPIs
Mobile Network performance monitoring KPIs are essential metrics that measure the efficiency and quality of a mobile network. By closely monitoring these indicators, telecom operators can identify areas for improvement, optimize network resources, and ultimately enhance the user experience.
Key Telecom Performance Management Metrics
Several vital metrics contribute to overall telecom network performance:
Call drop rate is the percentage of calls terminated prematurely. A high call drop rate impacts user satisfaction and can lead to churn.
Data transfer rate is the speed at which data is transferred over the network. Faster data speeds enhance the user experience for video streaming and file-sharing applications.
Latency is the time data takes to traverse the distance between its starting point and final destination. Minimizing latency is crucial for applications that demand real-time interactions, such as autonomous vehicles.
Jitter is the variation in network delay. High jitter can degrade voice and video quality.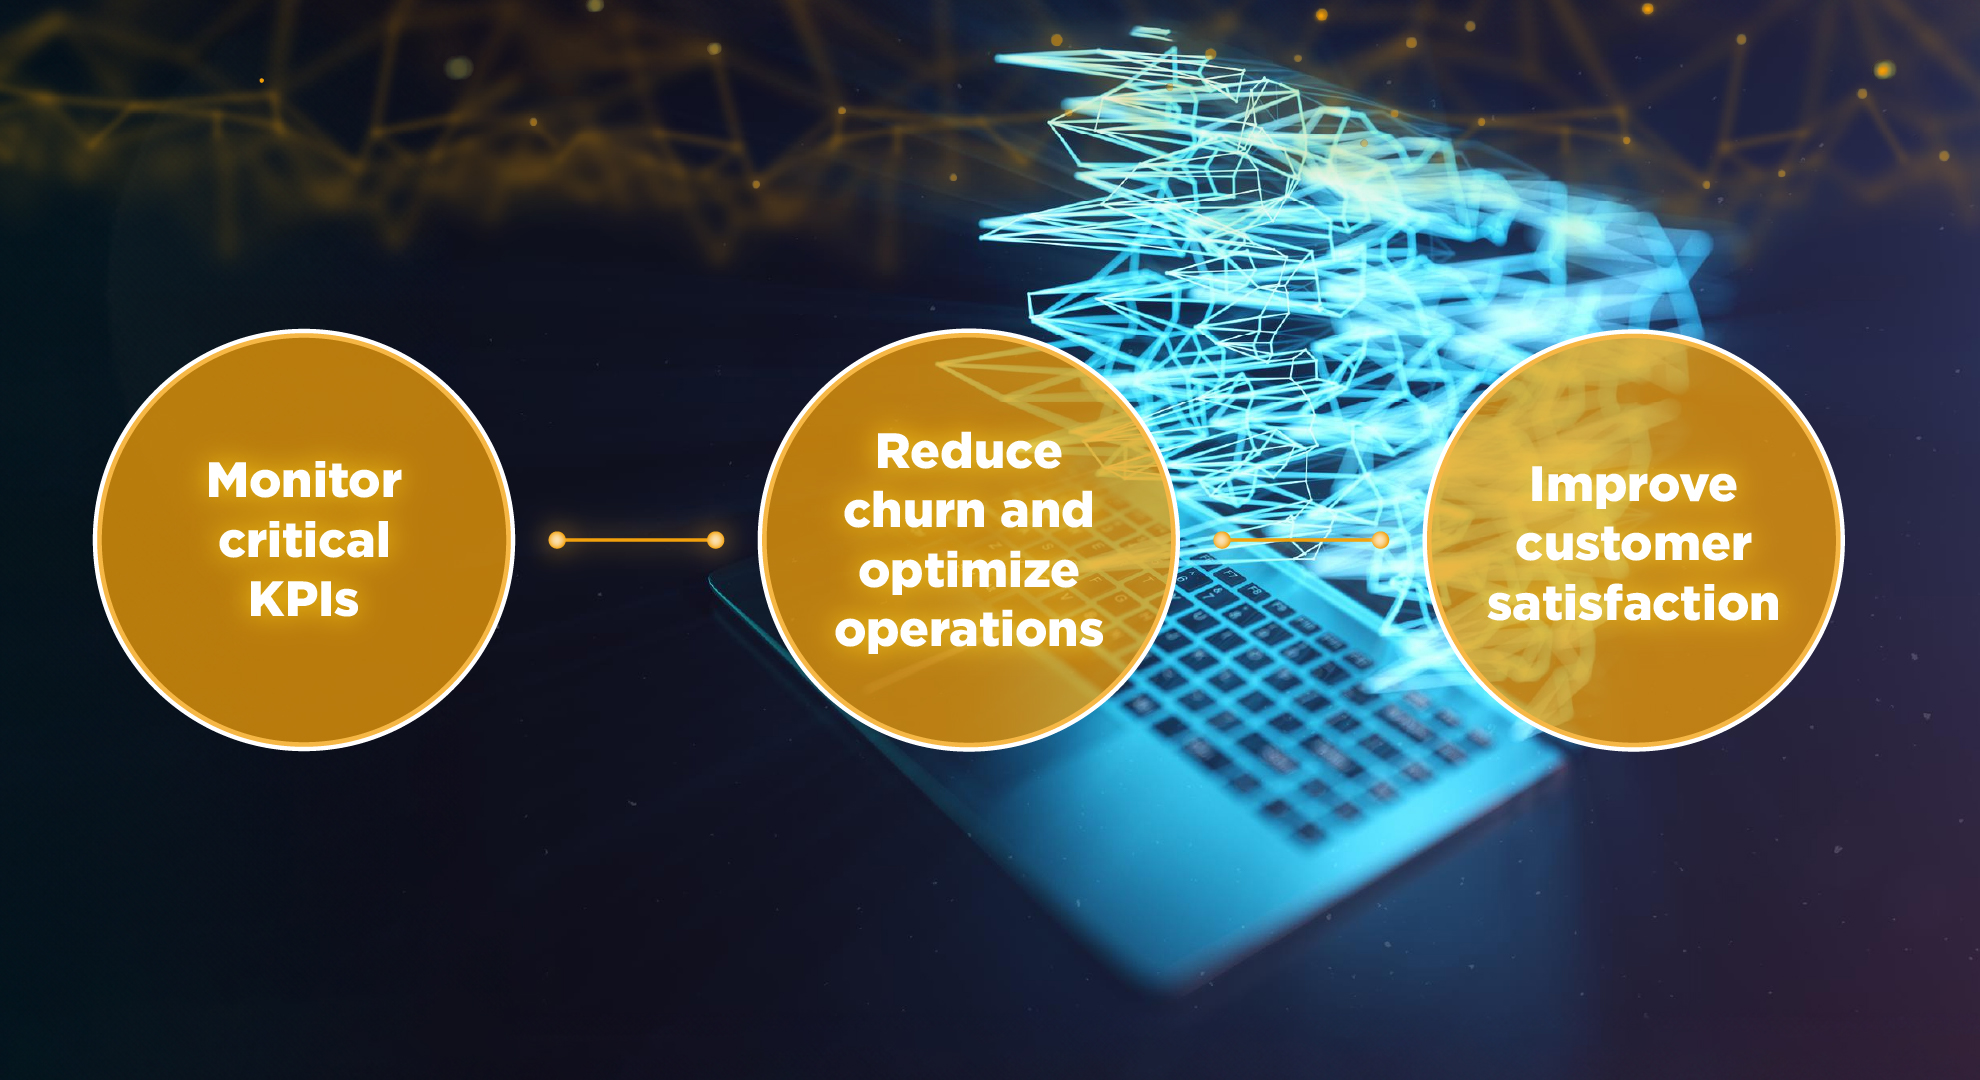
The Impact of Telecom Network Performance on Customer Churn and the Role of Self-Organizing Network Management (SON)
Poor network performance is a leading cause of customer churn in the mobile industry. When users experience dropped calls, slow data speeds, or frequent connection issues, they are more likely to switch to a different provider. Therefore, optimizing network performance is crucial for retaining customers and driving revenue.
Self-Organizing Network Management (SON) is a critical technology that can significantly improve network performance and reduce churn rates. SON enables networks to automatically configure, optimize, and heal themselves, improving network efficiency and user experience.
Integrating Mobile Network Performance Management (NPM) and SON
By integrating Network Performance Management and SON solutions, telecom operators can create a powerful tool for network optimization. NPM provides the necessary data and insights into network performance, while SON automates making adjustments to improve it. This integration allows for:
Proactive issue identification: Network Performance Management can identify potential issues before they impact users, allowing SON to take corrective actions.
Automated network optimization: SON can leverage network performance management data to adjust network parameters, such as cell power levels, interference management, and load balancing automatically.
Real-time performance optimization: By continuously monitoring network performance and making real-time adjustments, SON can optimize the network to change traffic patterns and user demands.
Reduced operational costs: Automating network optimization tasks can save significant costs.
Real-time performance optimization: By continuously monitoring network performance and making real-time adjustments, SON can optimize the network to change traffic patterns and user demands.
Reduced operational costs: Automating network optimization tasks can save significant costs.
Mobile Network Performance KPIs by Category
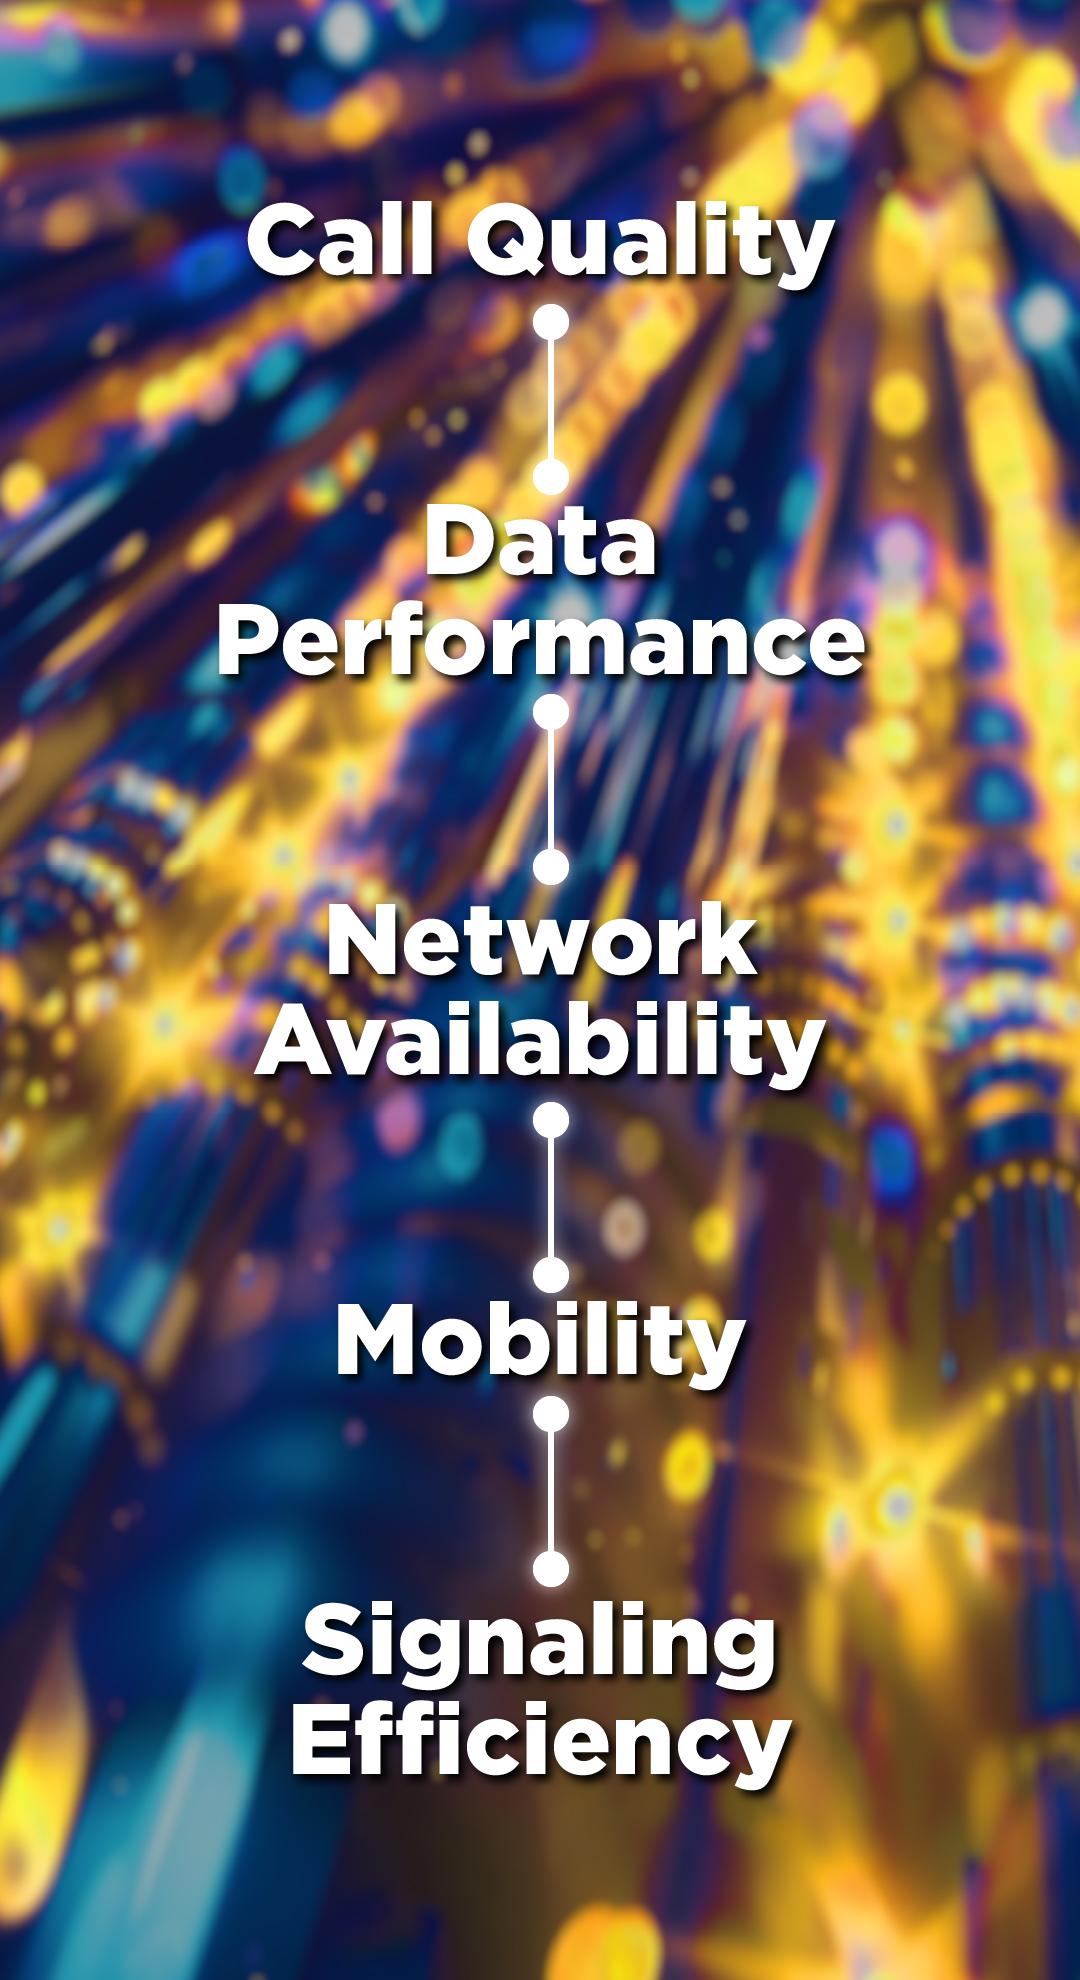
Understanding the complexities of mobile networks requires a structured approach to measuring performance. By categorizing Key Performance Indicators (KPIs), we can gain valuable insights into various aspects of network quality. This report presents a comprehensive overview of mobile network performance, organizing KPIs into five essential categories:
- Call Quality,
- Data Performance,
- Network Availability,
- Mobility, and
- Signaling Efficiency.
Categorization enables a focused analysis of specific network characteristics, facilitating targeted performance improvement efforts. Some KPIs may contribute to multiple categories, reflecting the interconnected nature of mobile networks. For instance, the Handover Success Rate influences Call Quality (minimizing interruptions) and Mobility (enabling seamless transitions).
By applying this categorization framework, network operators can identify areas for optimization, prioritize improvement initiatives, and ultimately enhance the overall user experience.
In the following sections, we will examine each category, providing detailed explanations of relevant KPIs and their significance in evaluating mobile network performance.
Call Quality
- Call Setup Success Rate: Measures the efficiency of establishing voice calls. A high rate indicates a well-functioning network.
- Signaling Channel Congestion Rate: This rate reflects the load on the signaling network. A low rate ensures timely call setup and reduced call drops.
- Handover Success Rate: This indicates the network’s ability to maintain calls during user movement. A high rate ensures uninterrupted service.
- Signal Interference: Measures the level of interference affecting call quality. Low interference results in more explicit calls.
- Circuit Switched Network Quality Indicator (CS-NQI): Measures the quality of voice calls. Higher values indicate better voice quality.
- Circuit Switched Call Retention Rate: This rate indicates the ability to maintain active voice calls. A high rate means fewer dropped calls.
- Voice over IP Network Quality Indicator (VoIP NQI): This indicator measures the quality of voice calls over LTE. Higher values indicate better call quality.
- Voice over IP Call Retention Rate measures the network’s ability to maintain active VoIP calls. A high rate means fewer VoIP call drops.
- Voice over IP Mobility: Measures maintaining VoIP call quality during user movement. A high rate means better VoIP call quality while moving.
- Voice over IP Call Drop Rate: Measures the rate of dropped VoIP calls. A low rate means better VoIP call quality.
Data Performance
- Packet Switched Network Quality Indicator (PS-NQI): Measures the quality of data services. Higher values indicate better data speeds and lower latency.
- Packet Switched Session Retention Rate: It indicates the ability to maintain active data sessions. A high rate means fewer connection drops.
- Packet Switched Network Accessibility: Measures the ease of accessing data services. A high rate means faster data connection establishment.
- Packet Switched Radio Access Bearer Drop Rate: Measures the rate of dropped data connections. A low rate means fewer data connection drops.
- Enhanced Network Quality Indicator (E-NQI): Measures the overall quality of the 4G network. Higher values indicate better performance.
- Enhanced Network Accessibility: Measures the ease of accessing the 4G network. A high rate means faster network access.
- Voice over IP Enhanced Radio Access Bearer Setup Success Rate: Measures the success rate of establishing data connections for VoIP calls. A high rate means a faster VoIP call setup.
Network Availability
- Traffic Channel Utilization: Indicates the efficiency of traffic channel usage. Optimal utilization ensures efficient resource allocation.
- Circuit Switched Network Accessibility: Measures the ease of accessing voice services. A high rate means faster call setup.
- Packet Switched Network Accessibility: Measures the ease of accessing data services. A high rate means faster data connection establishment.
- Radio Access Bearer Establishment Success Rate (RAB Establishment Success Rate): Measures the efficiency of establishing connections. A high rate means faster call setup.
- Radio Resource Control Connection Success Rate (RRC Connection Success Rate): Measures the efficiency of establishing control connections. A high rate contributes to better call quality.
- Circuit Switched Radio Access Bearer Drop Rate: Measures the rate of dropped voice connections. A low rate means fewer call drops.
- Enhanced Network Accessibility: Measures the ease of accessing the 4G network. A high rate means faster network access.
- Voice over IP Network Accessibility: Measures the ease of accessing VoIP services. A high rate means a faster VoIP call setup.
- Enhanced Network Retainability measures the network’s ability to maintain active connections. A high rate means fewer calls and data connection drops.
- Service Drop Rate: Measures the overall rate of service interruptions. A low rate means fewer service disruptions.
- Random Access Channel Success Rate: Measures the success rate of initial access to the network. A high rate means faster network access and improved user experience.
Mobility
- Handover Success Rate: This indicates the network’s ability to maintain calls during user movement. A high rate ensures uninterrupted service.
- Enhanced Network Mobility: Measures the network’s ability to handle user movement. A high rate means smoother handoffs.
- Voice over IP Mobility: Measures maintaining VoIP call quality during user movement. A high rate means better VoIP call quality while moving.
- S1 Interface Handoff Success Rate: Measures the success rate of handoffs between base stations on the S1 interface. A high rate means smoother call transitions.
- X2 Interface Handoff Success Rate: Measures the success rate of handoffs between base stations on the X2 interface. A high rate means smoother call transitions.
- Intra-Frequency Handoff Success Rate: Measures the success rate of handoffs within the same frequency band. A high rate means smoother call transitions.
- Inter-Frequency Handoff Success Rate for VoIP: Measures the success rate of VoIP calls during inter-frequency handoffs. A high rate means better VoIP call quality during handoffs.
- Inter-RAT Handoff Preparation Success Rate for VoIP SRVCC: Measures the success rate of preparing for handoffs between different radio technologies for VoIP calls. A high rate means smoother transitions between networks and improved user experience.
Signaling Efficiency
- Radio Resource Control Setup Success Rate: Measures the success rate of establishing control connections. A high rate contributes to faster network access.
- S1 Signaling Connection Setup Success Rate: Measures the success rate of establishing connections between base stations. A high rate ensures efficient network operation.
- RRC Connection Success Rate (same as network availability category)
- RAB Establishment Success Rate (same as network availability category)
5G Network Performance KPIs
- 3GPP, the standards body for mobile communications, defines a comprehensive set of KPIs to assess 5G network performance. These KPIs are categorized into various aspects of network operation.
- Data Throughput: Measures the amount of data transmitted over the network in a given time.
- Latency: The time taken for data to travel from source to destination.
- Packet Loss Rate: The proportion of data packets lost during transmission.
- Network Availability: The measure of a network’s operational uptime.
- Energy Efficiency: The ratio of data transmitted to energy consumed.
- Mobility: The ability of the network to handle users on the move.
- Spectral Efficiency: The amount of data transmitted per unit of spectrum.
- Connection Density: The number of devices connected per unit area.
Customer Experience KPI’s
Customer Experience (CX) KPIs are essential metrics that measure how customers perceive a company’s products or services. These metrics offer crucial data on customer happiness, retention, and the company’s overall success
Key Customer Experience Metrics
Customer Satisfaction (CSAT): A metric gauging customer contentment with a product, service, or interaction, often assessed through surveys or feedback channels.
Net Promoter Score (NPS): A measure of customer loyalty reflecting the likelihood of customers recommending a business. It is derived from customer responses to a specific question.
Churn Rate: The proportion of customers discontinuing a product or service within a specified timeframe. A high rate often signals customer dissatisfaction.
Average Revenue Per User (ARPU) is each customer’s average revenue. Increased ARPU often correlates with higher customer satisfaction.
Correlation Between Mobile Network Performance and Customer Satisfaction
Network performance is a critical factor influencing customer satisfaction. Reliable connectivity, fast data speeds, and minimal disruptions directly impact the overall customer experience. By monitoring network performance KPIs and correlating them with customer satisfaction metrics, telecom operators can identify areas for improvement and take corrective actions.
Measuring Customer Loyalty and Retention with KPIs
Customer loyalty and retention are closely linked to customer experience. KPIs help measure these aspects in the following ways:
NPS: A high NPS indicates strong customer loyalty and a higher likelihood of recommending the service.
Churn Rate: A low churn rate signifies high customer retention and loyalty.
Customer Lifetime Value (CLTV): Customer Lifetime Value (CLTV) forecasts the total revenue a customer will contribute to a business throughout their patronage. A high CLTV signifies strong customer loyalty and long-term value.
Monitoring these KPIs and analyzing their patterns empowers telecom operators to understand customer actions and implement strategies to enhance customer satisfaction and retention.

Mobile Network Efficiency KPI’s
Traffic Channel Utilization: Measures how efficiently traffic channels are being used. High utilization indicates efficient resource usage, while low utilization may indicate underutilization or network congestion.
Total Data Traffic Volume: The total data transmitted over the network. This metric is crucial for capacity planning and network dimensioning.
Downlink Data Traffic Volume: The data transmitted from the network to the user devices. High downlink traffic indicates increasing demand for data services.
Uplink Data Traffic Volume: The data transmitted from user devices to the network. This metric reveals patterns in user actions and application interactions.
User Average Downlink Throughput is the average data rate experienced by individual users. Higher throughput indicates a better user experience.
User Average Uplink Throughput is the average data rate experienced by individual users when uploading data. Higher throughput enables faster uploads and a better user experience for video conferencing and file-sharing applications.
Cell Average Downlink Throughput is the average data rate achievable within a cell. This metric helps identify areas with capacity constraints and optimize network performance.
Cell Average Uplink Throughput is the average data rate achievable within a cell for uplink traffic. This metric helps identify areas with capacity constraints and optimize network performance.
Importance of Superior Service
Network efficiency KPIs are essential for delivering superior service to end users by:
Optimizing resource utilization: Efficient use of network resources leads to improved performance and reduced costs.
Capacity planning: Accurate data traffic analysis helps plan network expansions and upgrades to meet growing demand.
Quality of Service (QoS): Network operators can ensure consistent service quality for all users by monitoring throughput and traffic patterns.
Cost reduction: Efficient network operation leads to lower operational expenses.
Customer satisfaction: Improved network performance directly impacts user experience and satisfaction.
Conclusion
Effective telecom performance management is pivotal for delivering exceptional mobile experiences. By meticulously monitoring and analyzing key performance indicators (KPIs), operators can optimize network operations, enhance customer satisfaction, and drive business growth.
Improved network performance directly translates into enhanced user experiences. By meticulously managing and optimizing network operations, telecom providers can deliver faster speeds, lower latency, and greater reliability, ultimately driving customer satisfaction and loyalty.
Implementing advanced tools like Self-Organizing Network (SON) management software can revolutionize network operations. SON’s ability to automate network configuration, optimization, and healing empowers operators to achieve significant efficiency gains and improve overall network performance.
A holistic approach encompassing robust network performance management systems and intelligent automation solutions is essential for thriving in today’s competitive mobile landscape. By embracing these strategies, operators can be leaders in delivering exceptional customer experiences.